
A2.1 Why data matters: Informing decisions, guiding action
The first questions asked when assessing a disaster or crisis are ‘how big/bad’, ‘where’ and ‘to whom’ the impacts will be felt. To answer these questions, we need data. In recent years, the volume of data produced to help answer these questions has mushroomed. As a result, the ability to build systematic methods for allocating resources, targeting assis- tance and anticipating crises has improved rapidly. Such methods enable humanitarian organizations to leverage evidence to guide our principles and rules with the aim of providing assistance where it is needed most.
Building an evidence base for such principled decision-making requires transparency on what the data does – and does not – show; how it has been collected, produced or transformed; and how timely and reliable it is, based on previous experience. The data presented and analysed in this report has been collected into a database of databases – the Montandon Global Crisis Data Bank – which is designed as the world’s largest open source, open access repository for data on hazards, their impacts and the responses mobilized to respond to them.
One of the key motivations behind the development of the Montandon is to serve as a reference point for global trends, as presented below. In addition, we collect such a wide variety of data to help us triangulate, establish how much confidence we should have in forecasts, and curate the most useful information for our IFRC network and beyond.
We are grateful to many partners who have collaborated to build the Montandon, and for their tireless work in collecting data in the field and at home to serve as inputs into our collective intelligence.
A2.2 Recent trends
The data from 2020 to 2024 provides an illustrative snapshot of what we know, how we know it, and how data is being used to shift towards more anticipatory approaches to humanitarian crises.1
Looking across five years of crises and impact data, we focused on answering these key questions:
- How many events are occurring?
- Where are disasters occurring?
- How severe are they?
- How do communities respond – or take anticipatory action – with or without support from international actors?
- Which of these questions can we answer confidently and with what data?
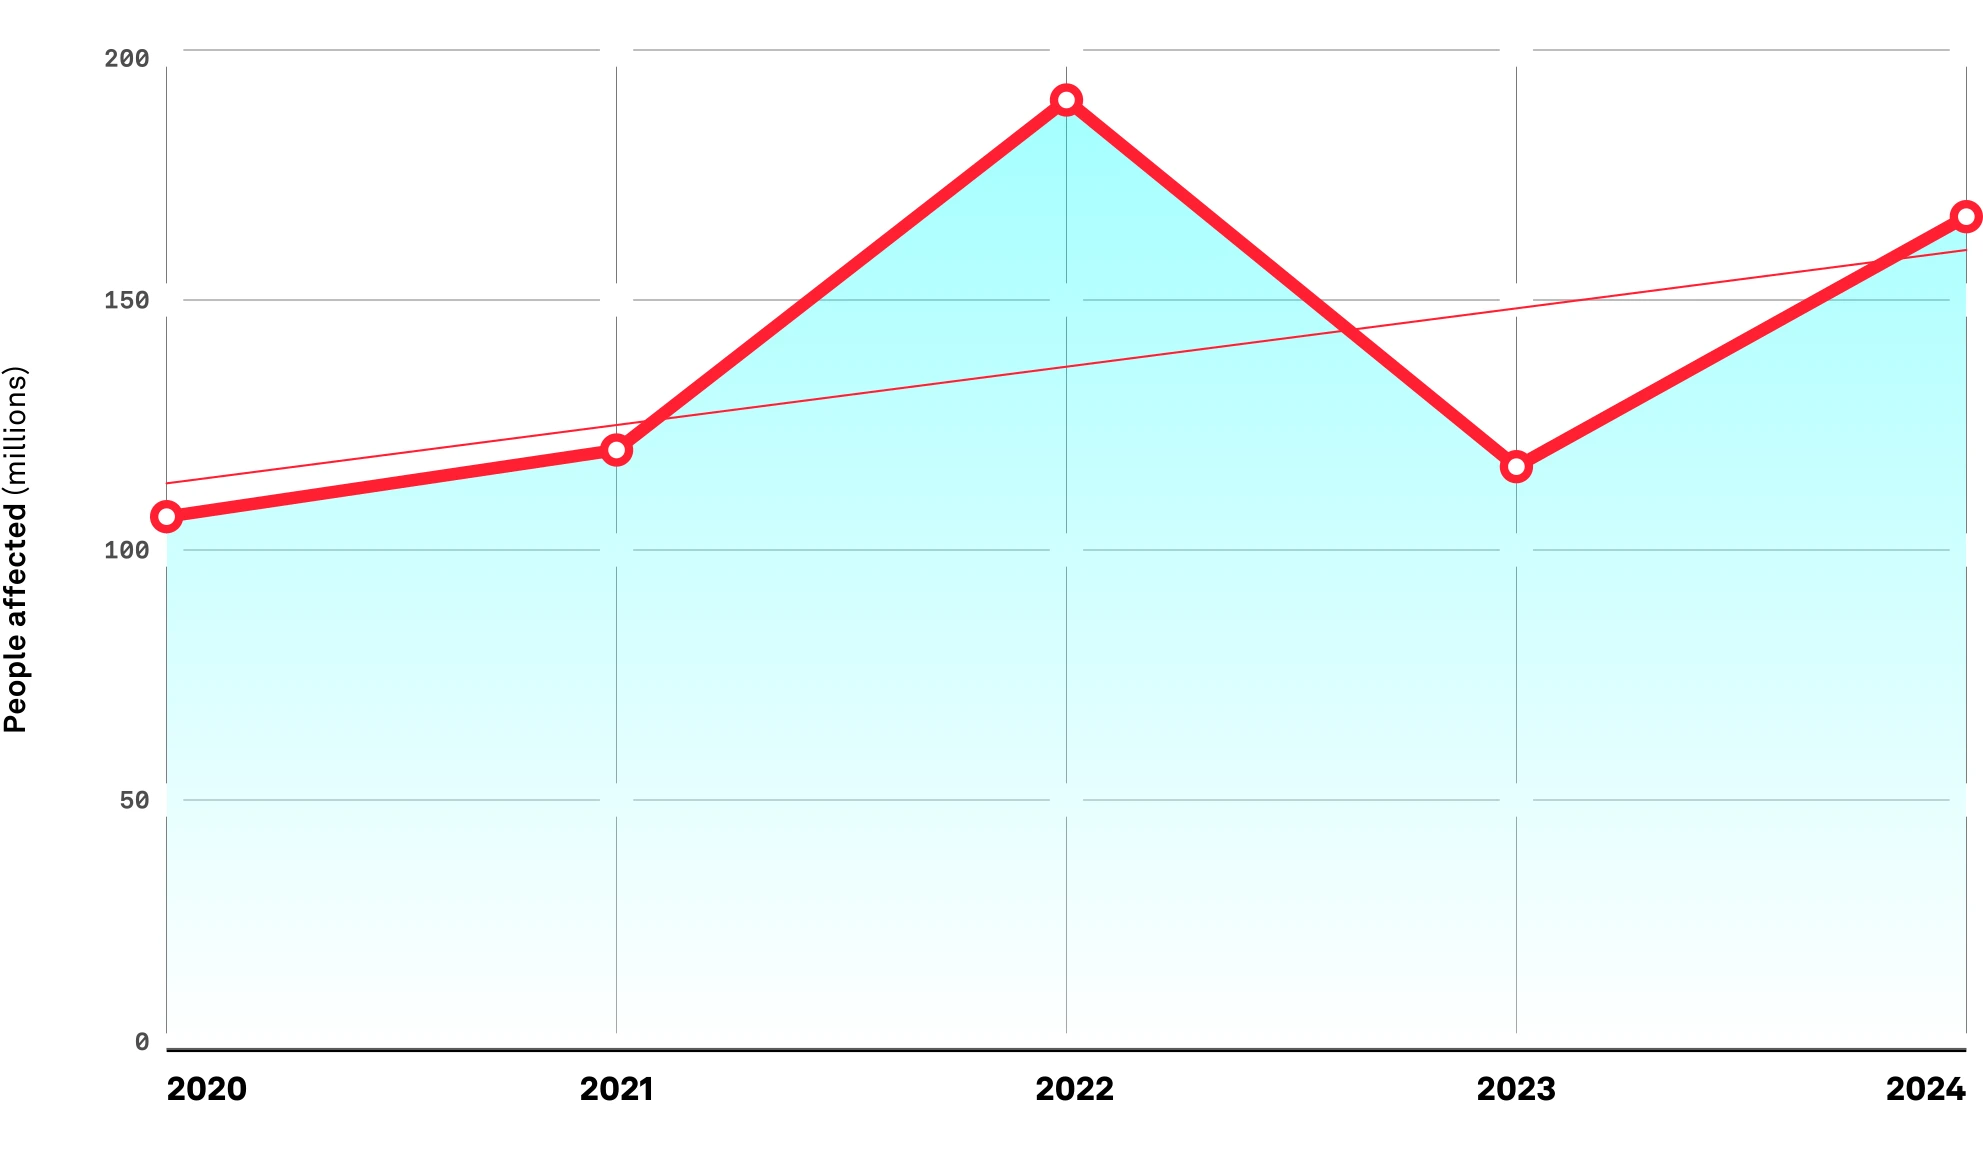
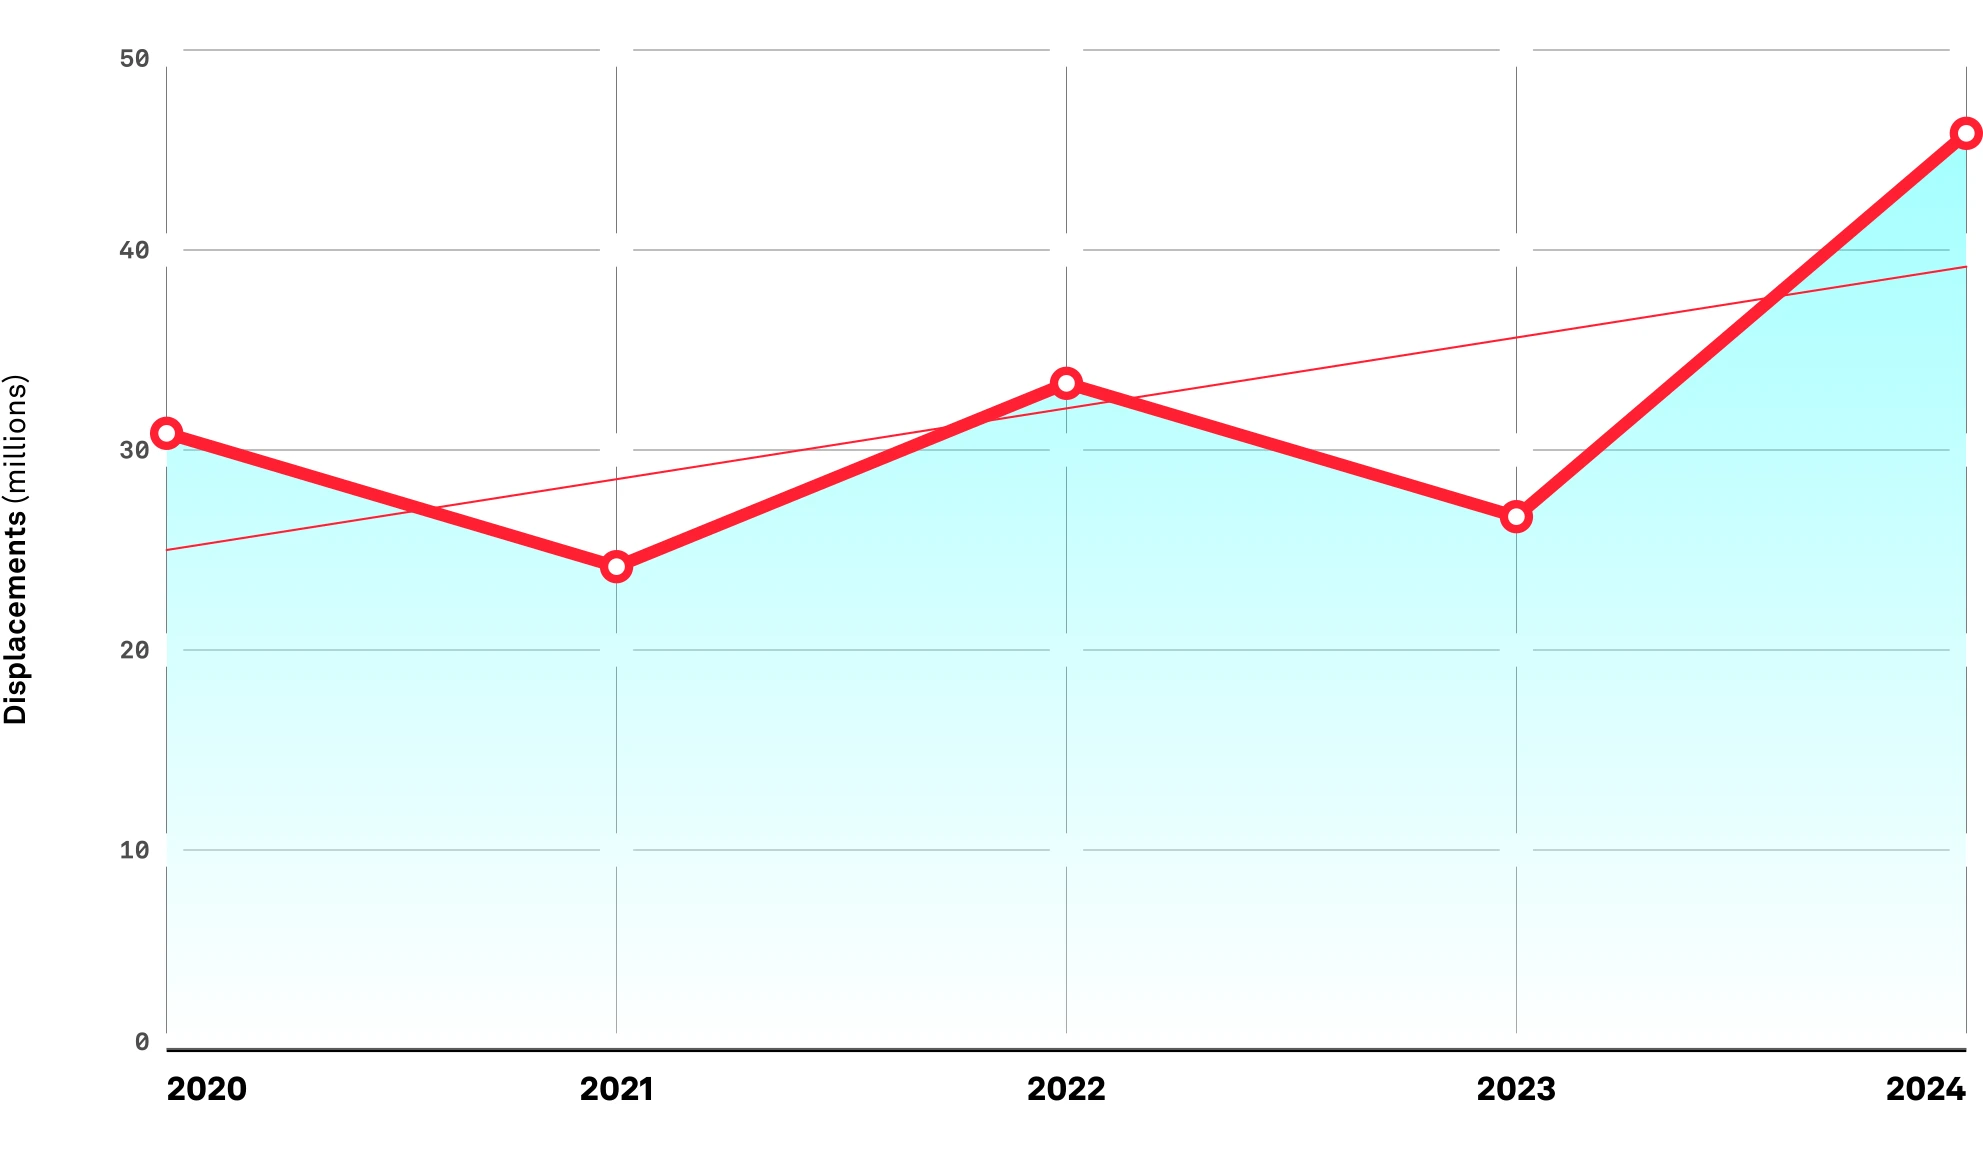
The number of people affected by disasters has steadily increased between 2020 and 2024 across two metrics: people affected (Figure A2.1.a) and displacements (Figure A2.1.b).
Number of people affected by disasters per year, 2020–2024
Number of disaster displacements recorded per year, 2020–2024
These increases reflect both a rise in the number of events (disasters) and improve- ments in how they are recorded. The Internal Displacement Monitoring Centre (IDMC), for example, recorded 14,348 individual disasters between 2020 and 2024 (inclusive) (Figure A2.2).2
Number of disasters recorded per year, 2020–2024
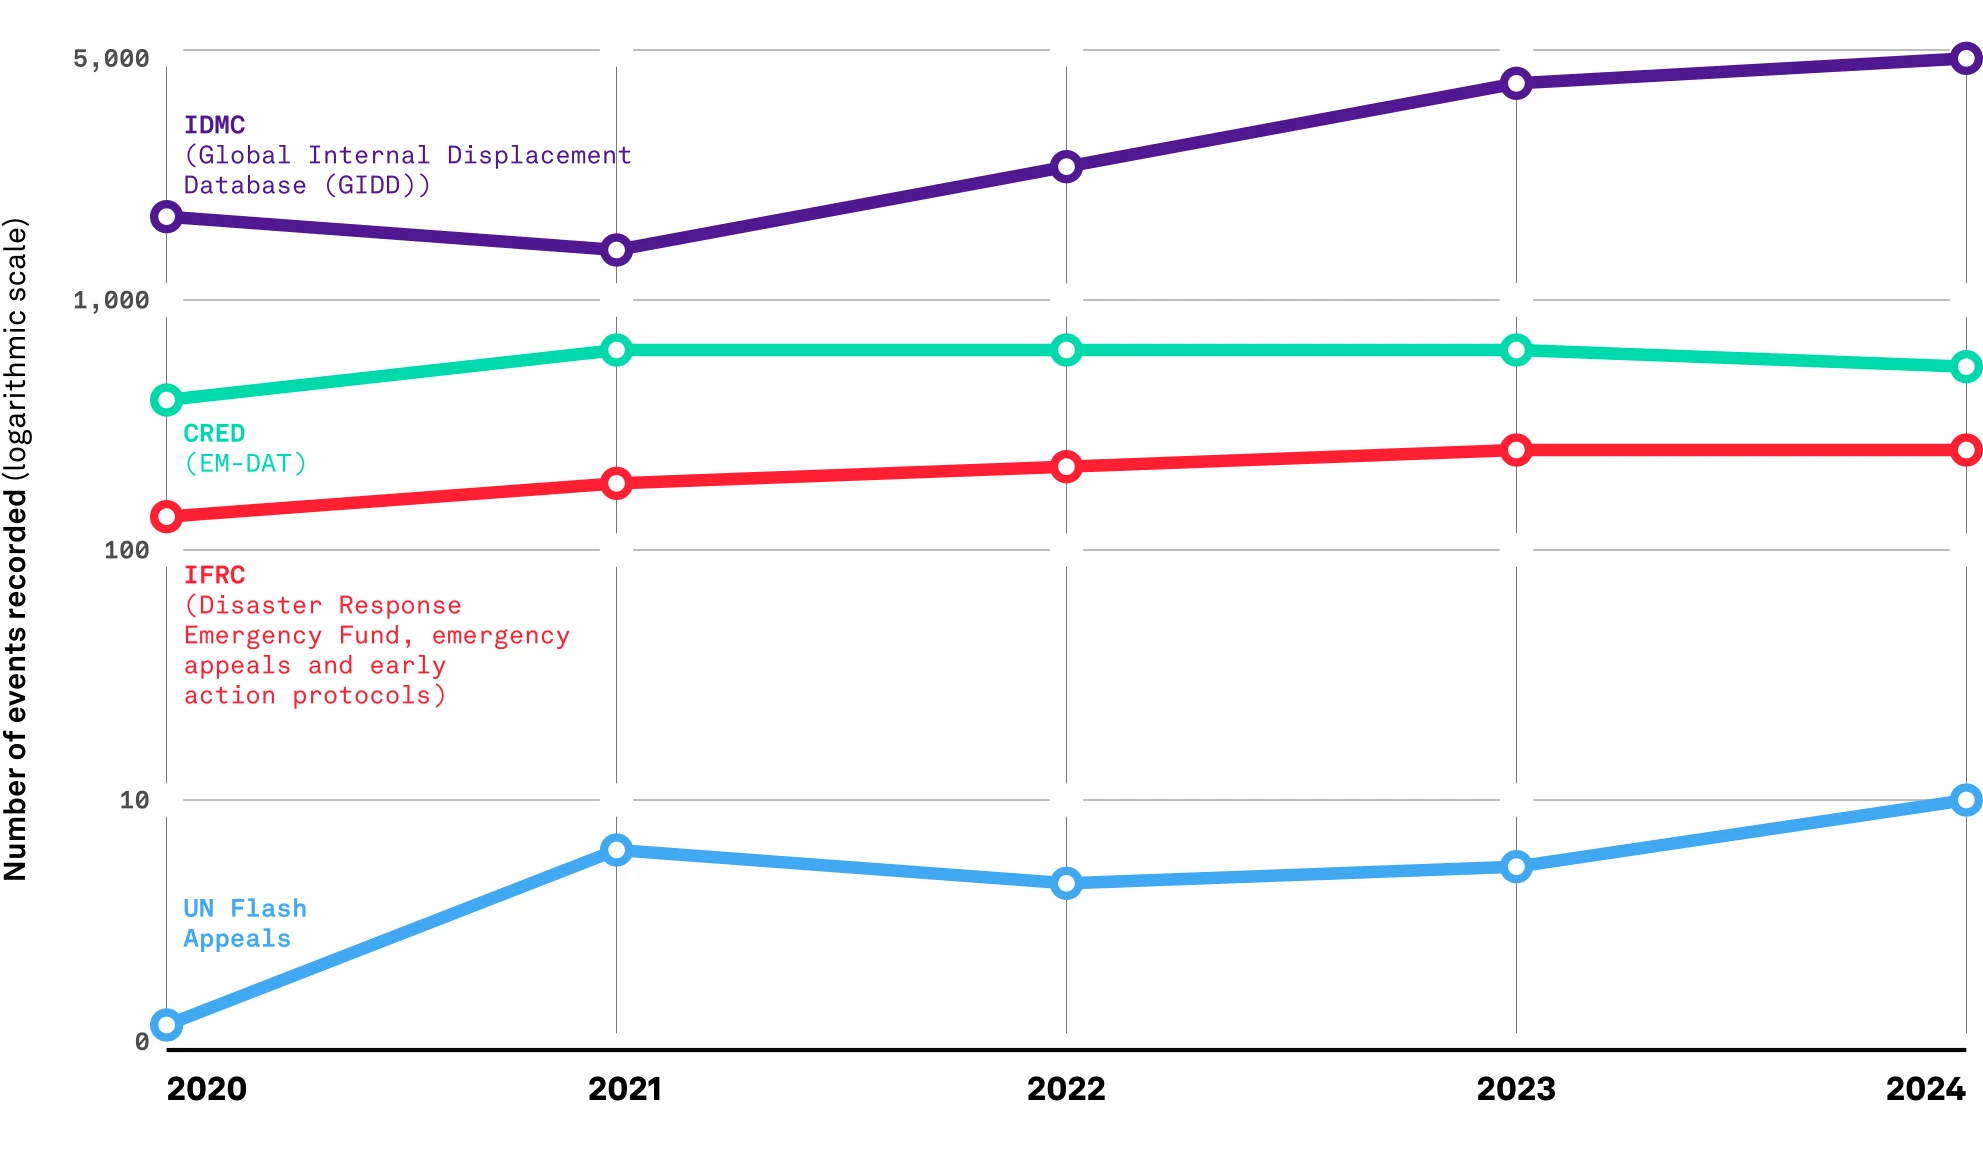
The data also shows that most disasters are being managed through the capacities of national and local actors. Comparing the largest estimated total number of events (IDMC) with those that triggered an international humanitarian response (as recorded by IFRC and the UN Office for the Coordination of Humanitarian Affairs), reveals that in the vast majority of cases, national governments and local communities responded without requesting, directly or indirectly, international assistance.
Number of requests by National Societies for international assistance, 2020-2024
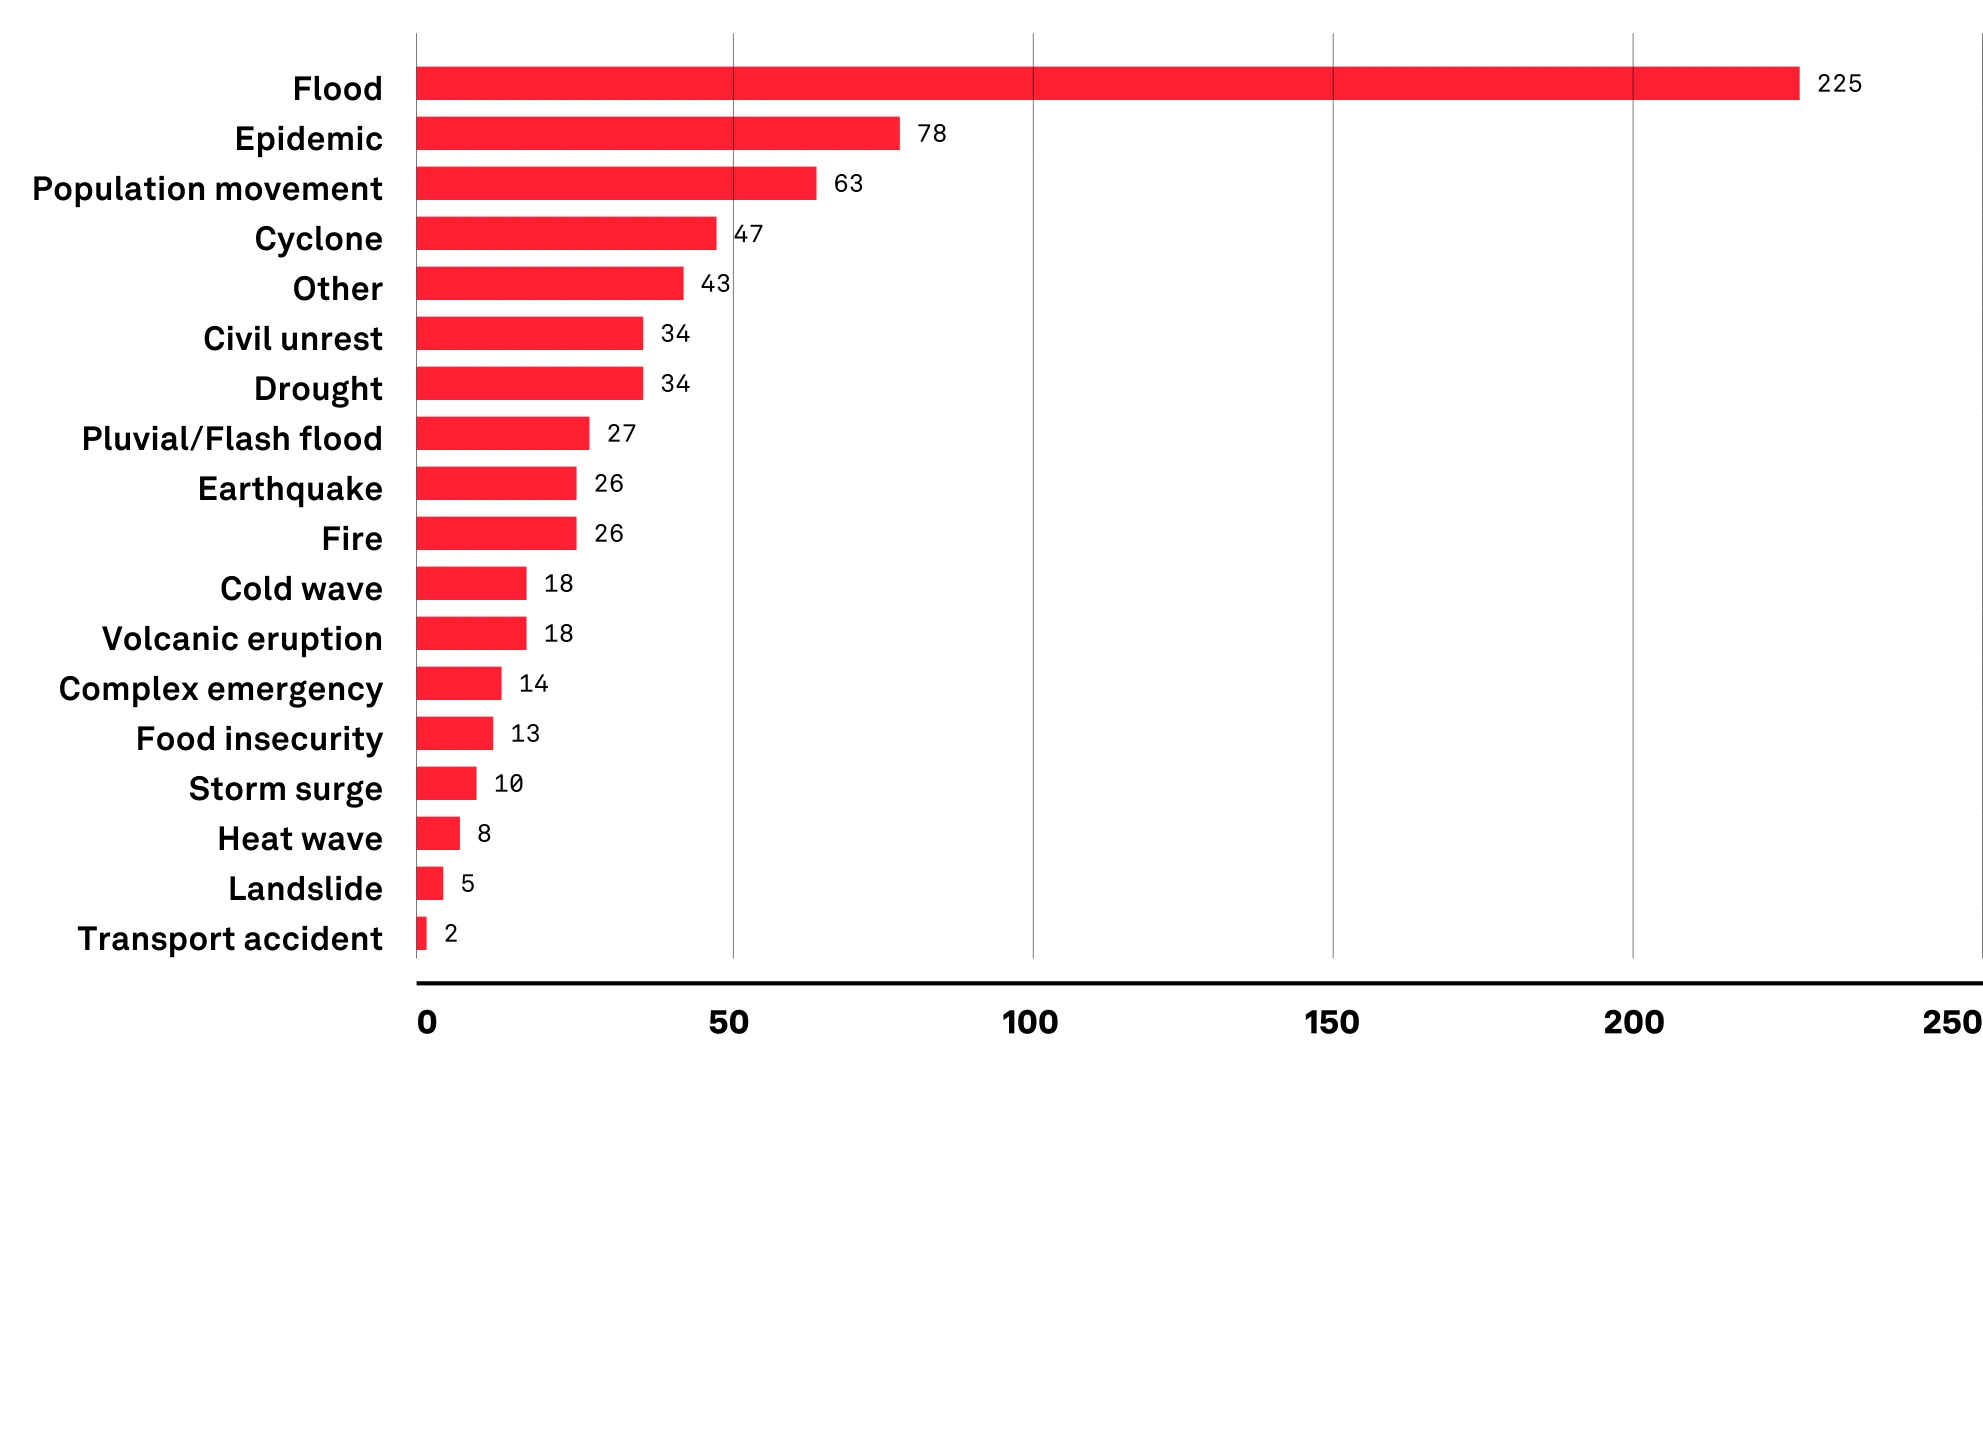
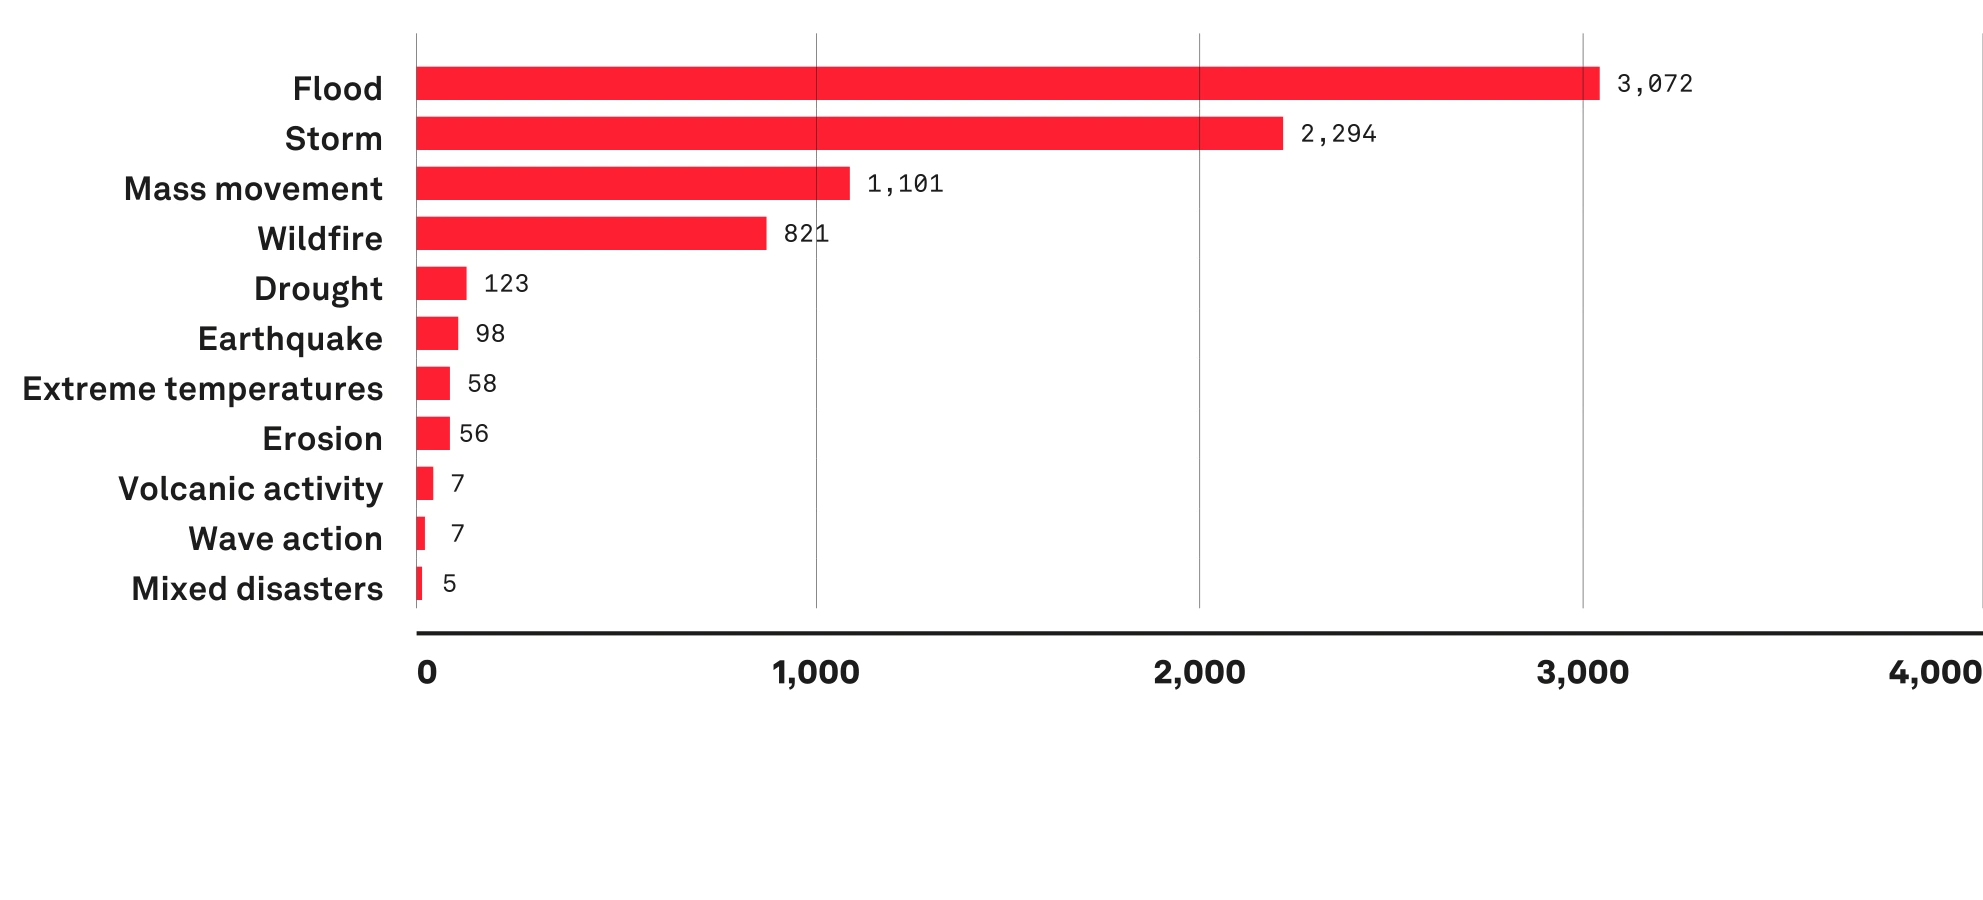
Figure A2.3 shows the number of requests received by the IFRC from National Societies for international assistance, the majority of which relate to floods. The fact that most disasters are managed predominantly nationally and locally is both appropriate and a sign of resilience. This is because the majority of disasters are caused by frequently occurring, low-intensity hazards that affect a relatively small number of people and communities. For example, of the 14,348 displacement-causing disasters recorded by IDMC, more than half (7,642 events, or 53%) displaced 100 or fewer people – predomi- nantly due to localized floods, storms and landslides (Figure A2.4).
Number of events that displaced 100 or fewer people, by hazard type, 2020–2024
Disasters have always occurred but we are becoming better able to detect and understand this trend due to greater investment and improvements in data collection, particularly for smaller-scale events.
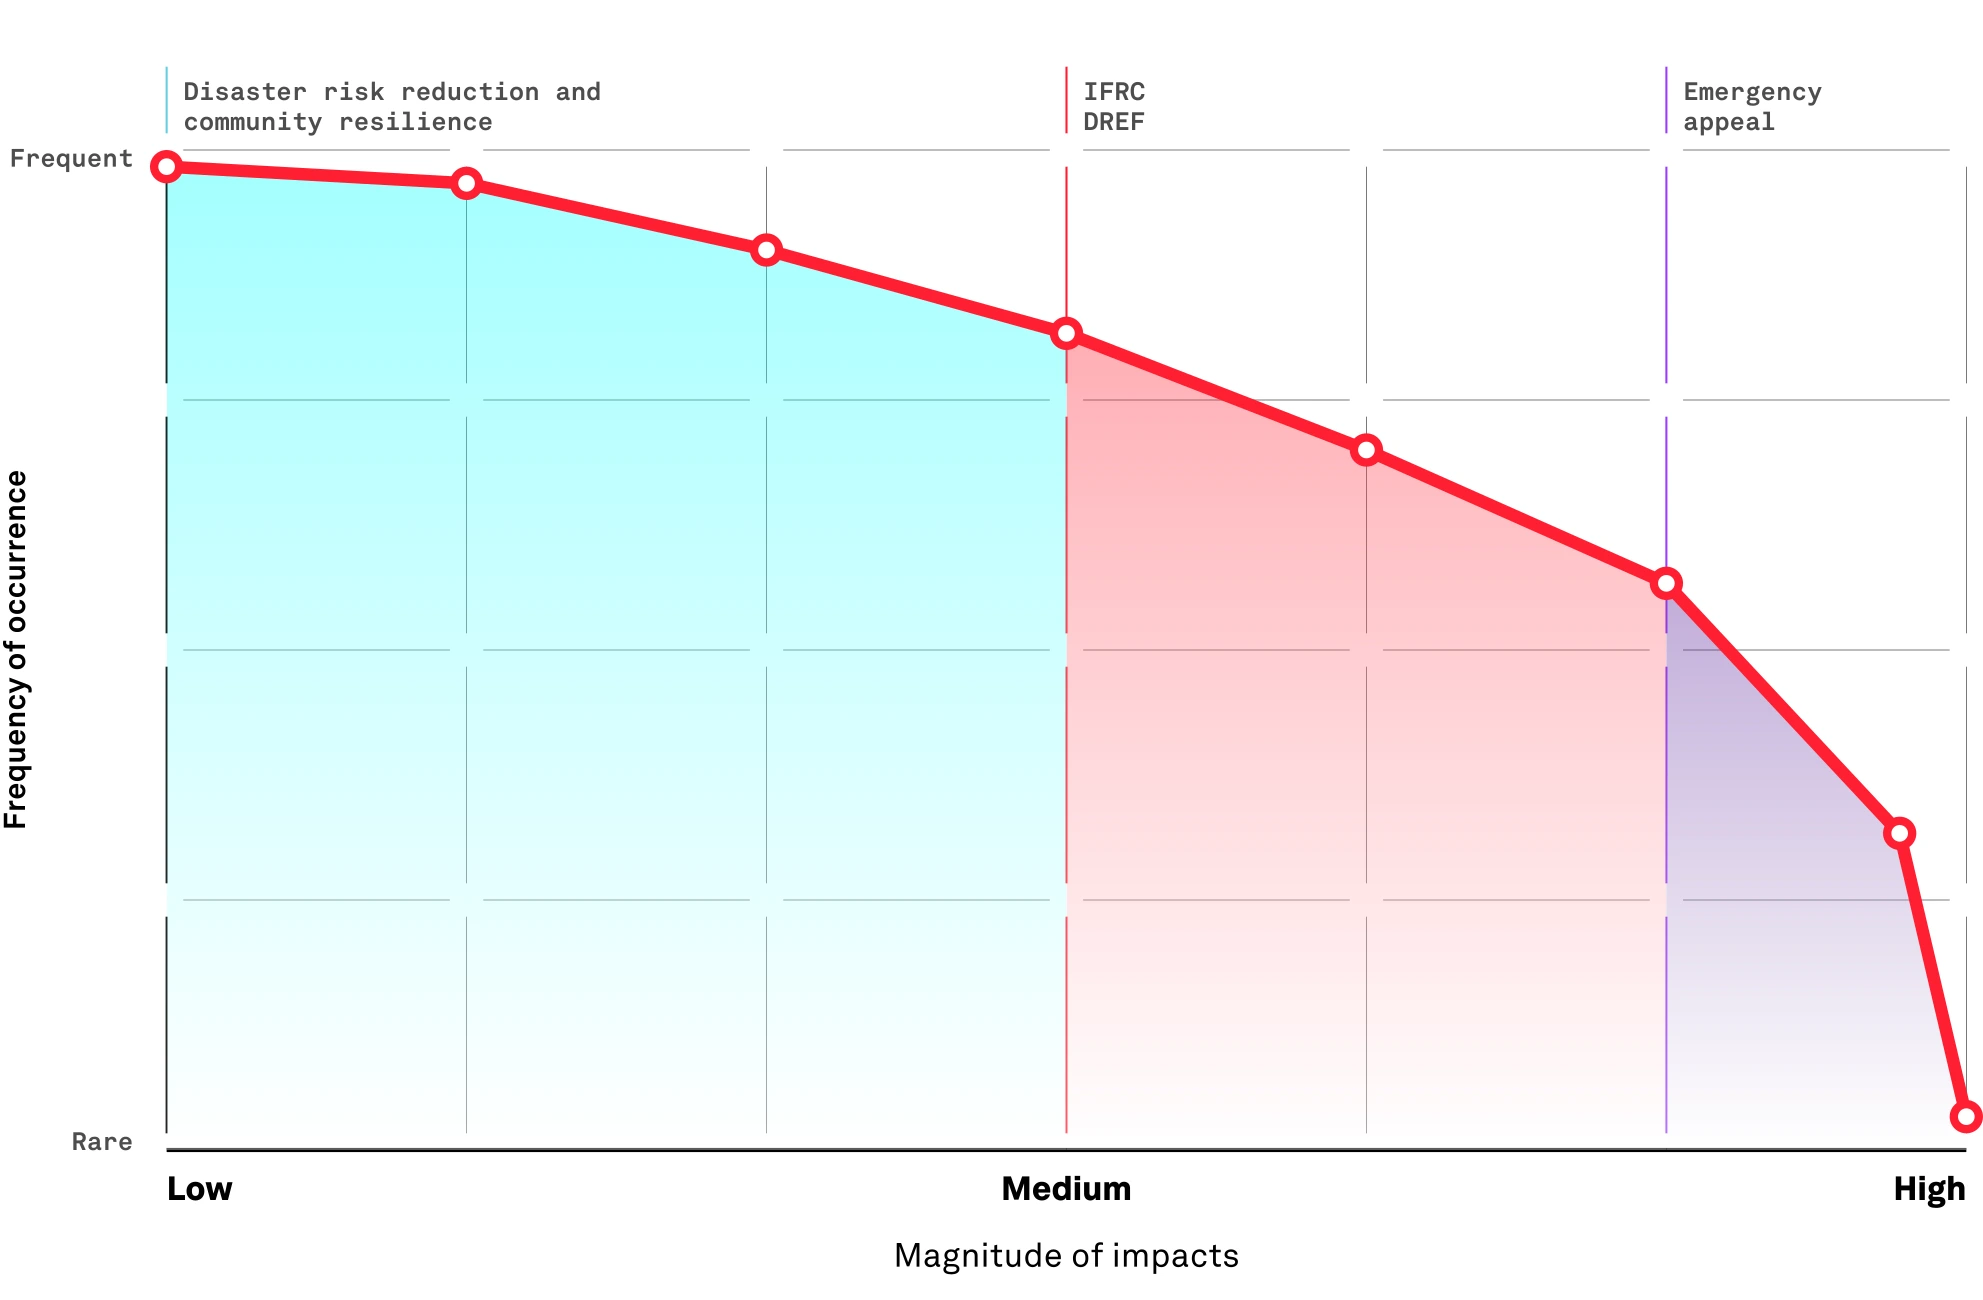
For decades, the IFRC has allocated its funds and mobilized international humanitarian assistance in line with the scale of disasters: strengthening National Society capacities in disaster risk reduction, preparedness and response to manage ‘smaller’ disasters, using the Disaster Response Emergency Fund (DREF) for medium and large disasters, and launching emergency appeals for the more infrequent catastrophic events (Figure A2.5).
How IFRC and other humanitarian actors manage risk across the sector
A2.2.1 Where are disasters happening?
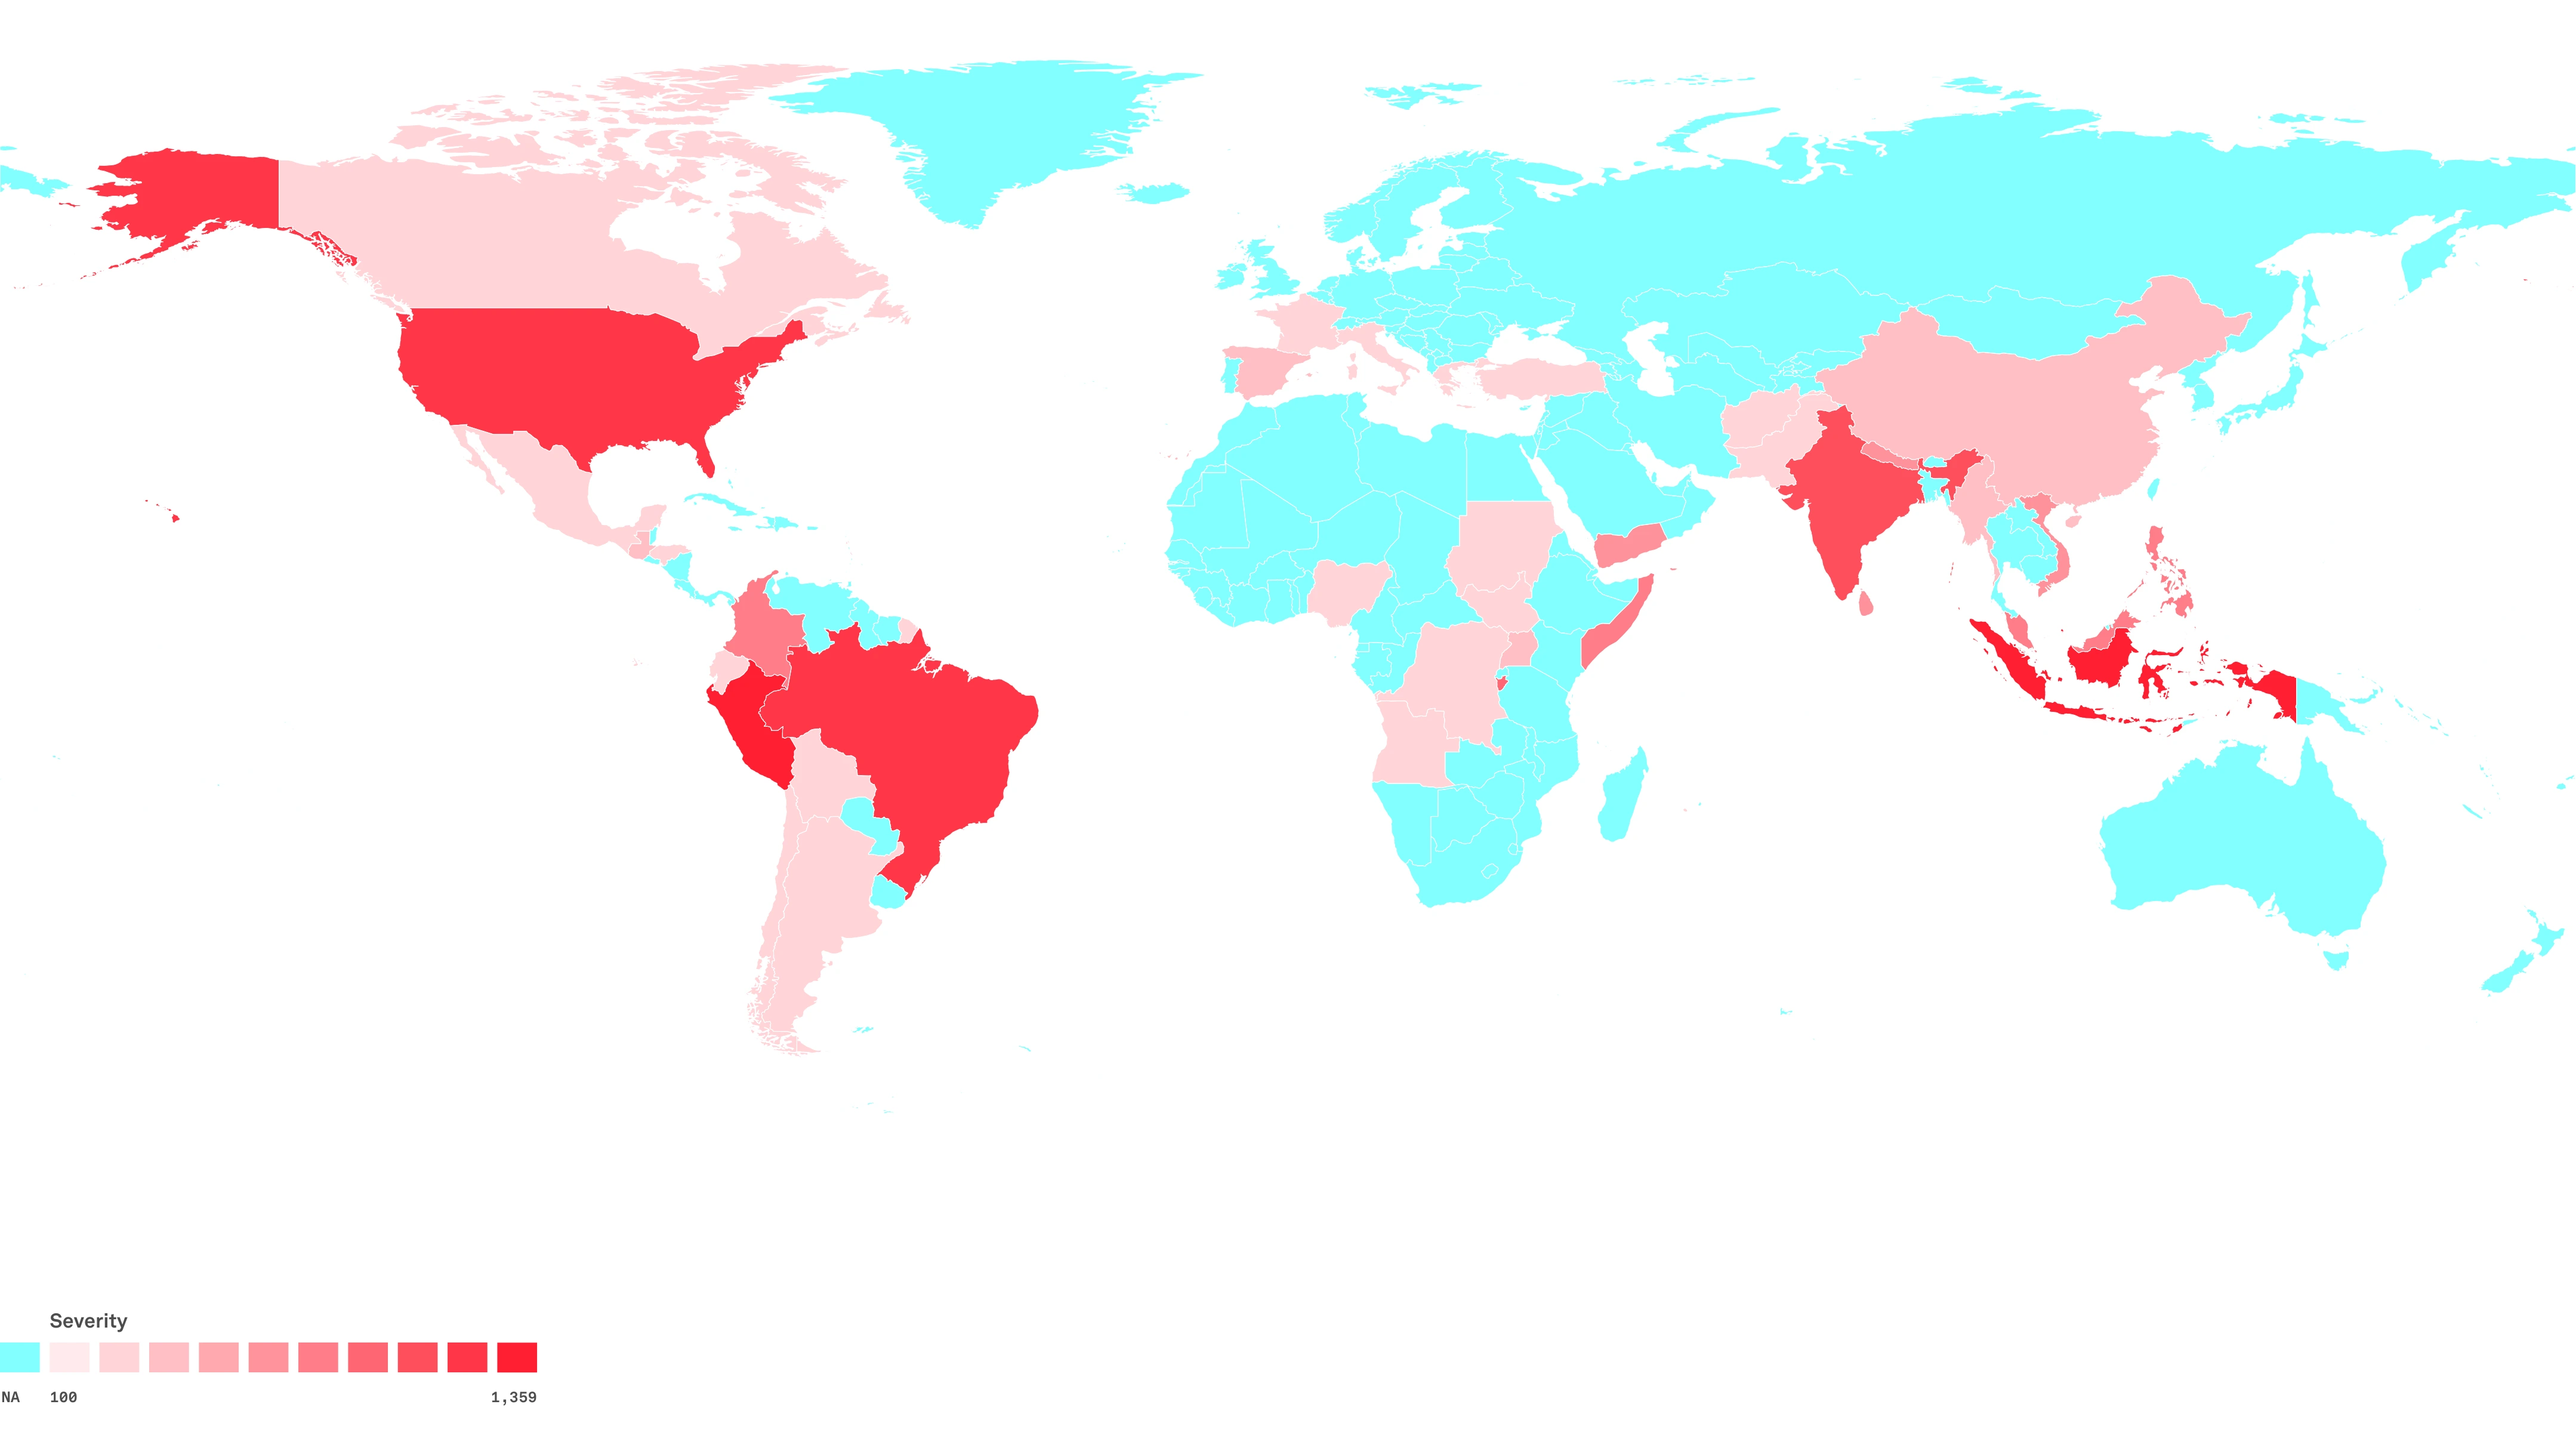
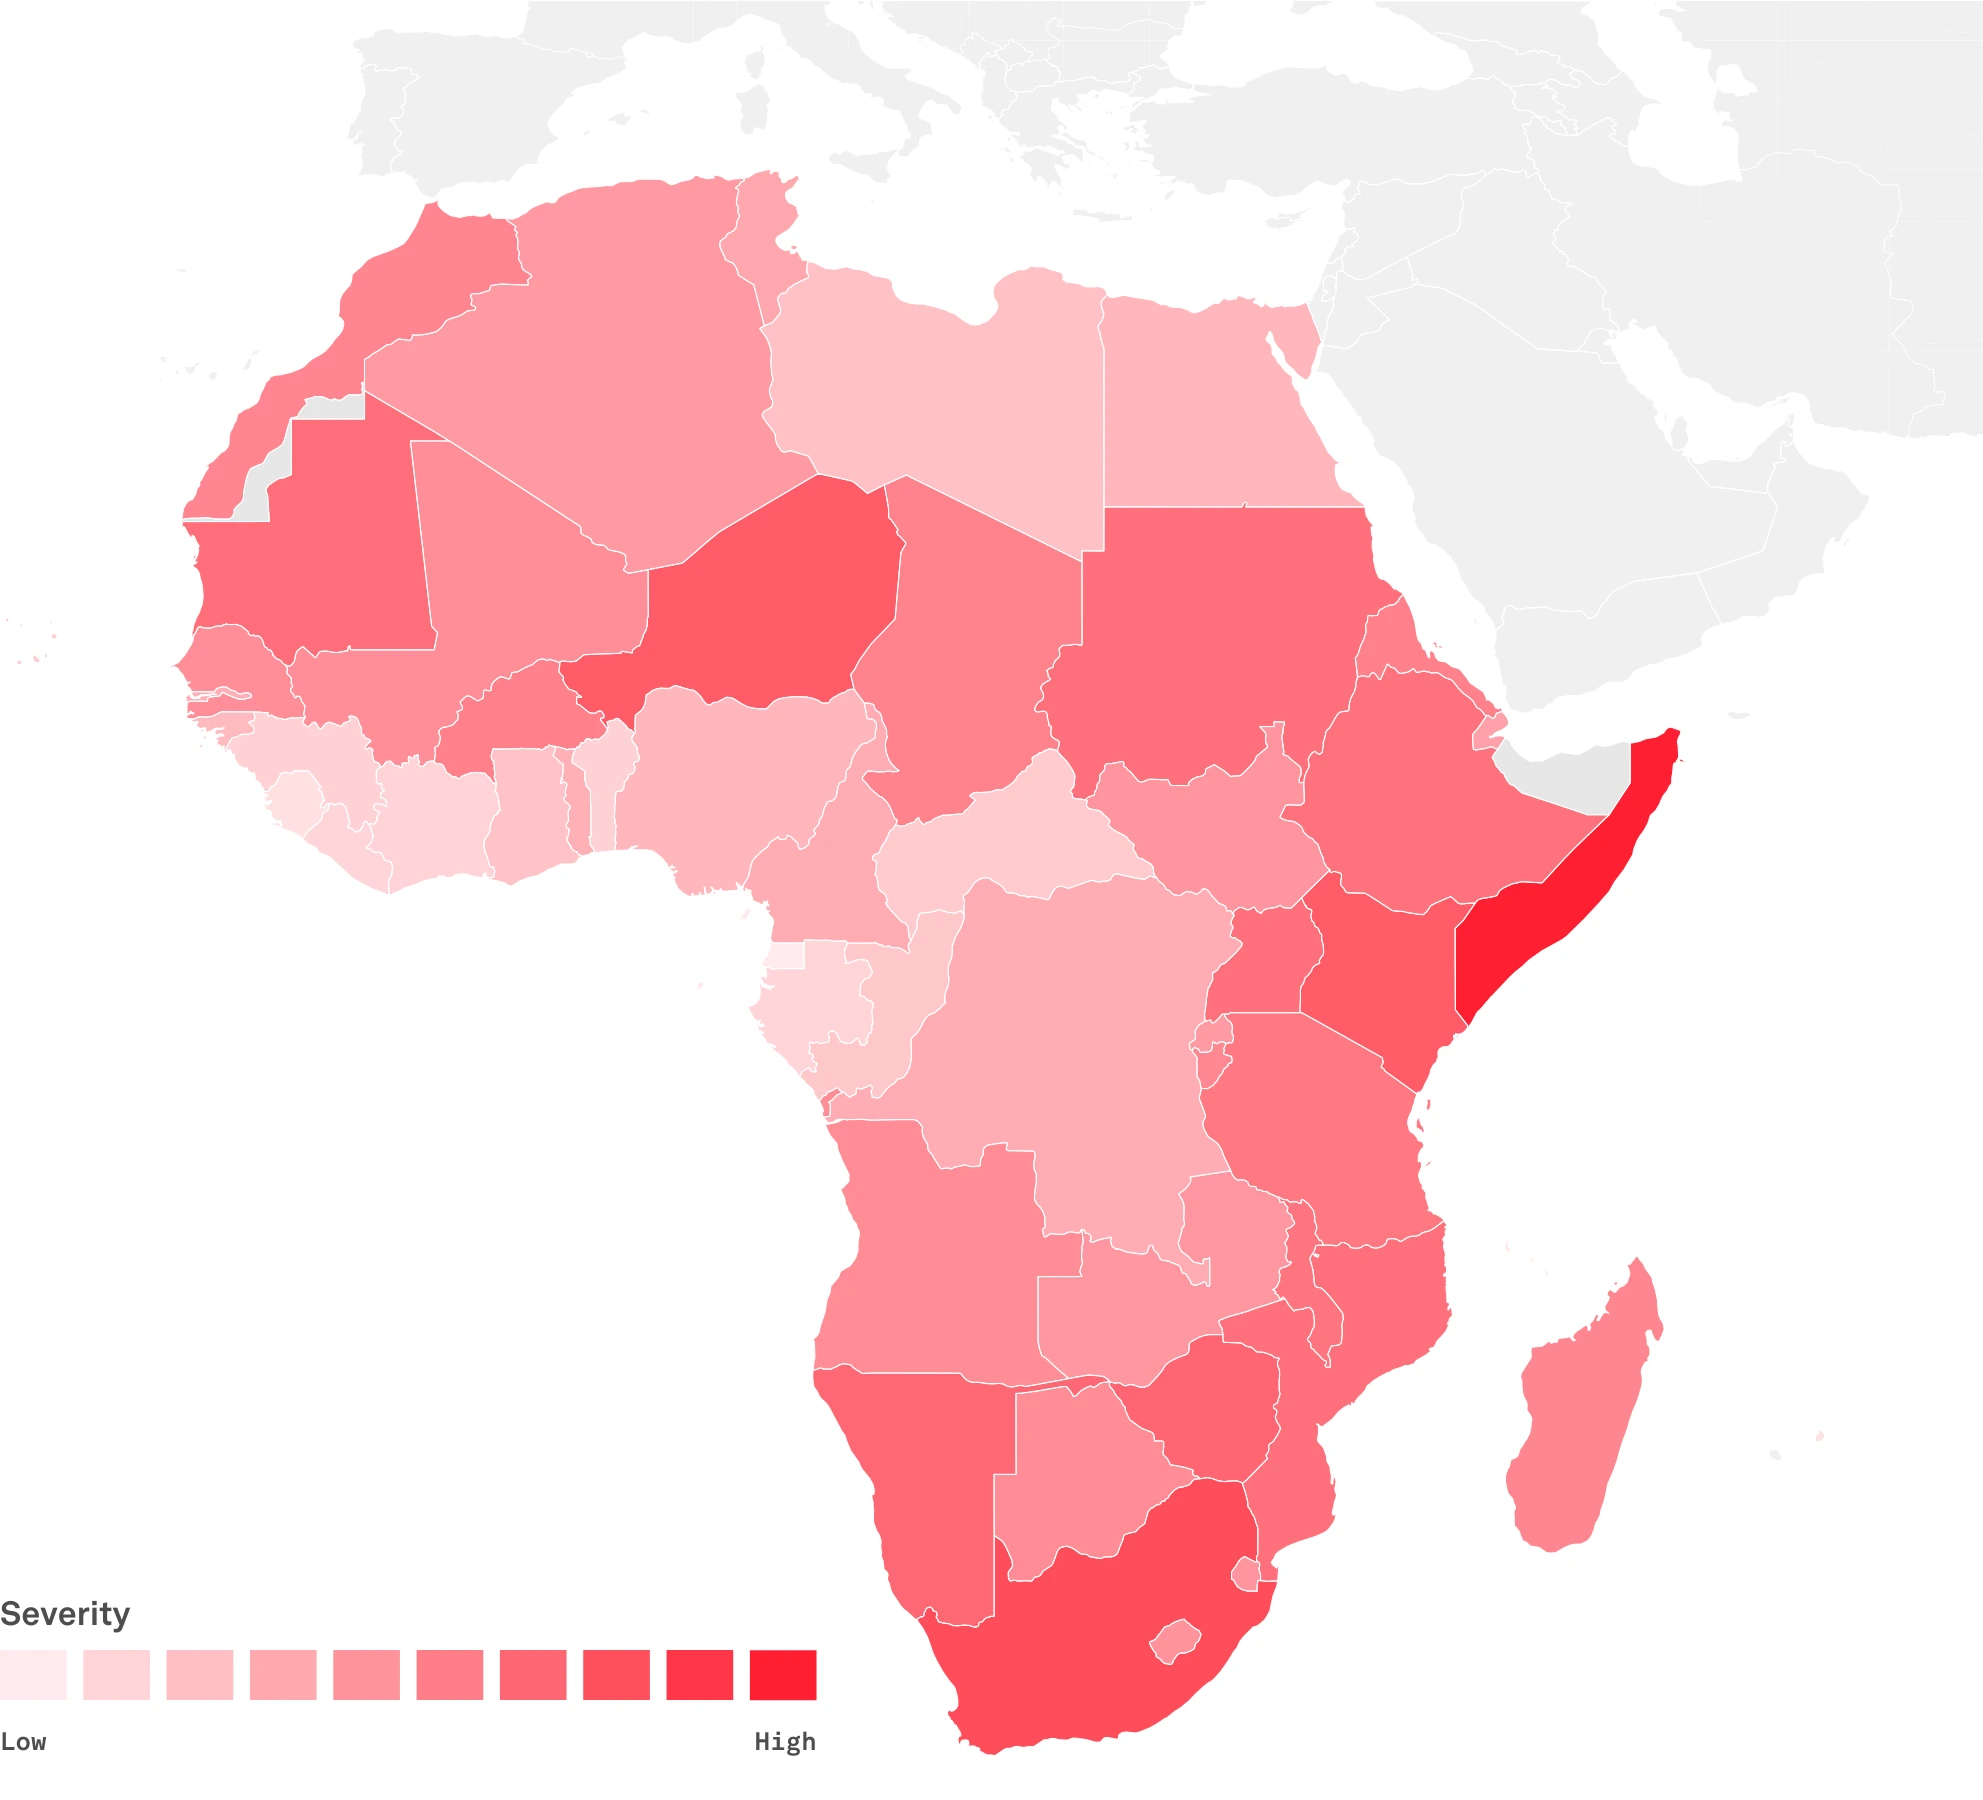
The geographical distribution of recorded disasters reveals some striking patterns: 84% of events (disasters) occurred in just 37 countries (Figure A2.6). At first glance, these countries appear diverse, spanning high-, upper-middle-, lower-middle- and low-income countries. What they share, however, is both hazard exposure and the capacity to systematically record the impacts of small, medium and large disasters, often in settings with large populations. A comparison of recorded impacts in Africa with disaster risk (Figure A2.6 and Figure A2.7) indicates that there is likely under-reporting across many countries.
Countries where most disasters are recorded: 2020–2024
Countries in Africa by risk of flooding and cyclones
A2.2.2 How severe are they?
Between 2020 and 2024, disasters affected some 697 million people,3 caused 105 million displacements and killed 271,000 people.4 The severity, as indicated by the number of people in need of humanitarian assistance, also increased during this time, from 192 million people in January 2020 to more than 433 million people at the end of 2024.5 According to the Intergovernmental Panel on Climate Change (IPCC), “Human-induced climate change, including more frequent and intense extreme events, has caused wide- spread adverse impacts and related losses and damages to nature and people, beyond natural climate variability.”6 Given that hydrometeorological hazards drive most of this risk, as shown in Figure A2.3 and Figure A2.4 above, it is expected that the number of people killed, displaced or otherwise affected by disasters will grow over the coming years.
A2.2.3 Where do we still struggle to answer these questions due to a lack of data?
The data paints a fairly comprehensive picture in some parts of the world (North and South America, Europe, Asia), but not others (Africa), and the impacts of certain hazards are significantly under-reported, particularly metrics related to extreme heat and diseases. Given that both of those types of hazards are influenced by weather and climate, it means our understanding of these risks and how to manage them need more resources and international attention.
Our ability to collect data on disasters has improved in recent years, but recent defunding of many, often small and independent, data collection organizations threatens that ecosystem of evidence building. The evidence base on which principled and effective humanitarian interventions are prioritized and implemented is, as a result, much poorer.
Concluding remarks: Lessons and looking ahead
- How many events are occurring? Many of the key sources show an increasing trend. For example, IDMC figures show 14,348 events between 2020–2024 compared to 5,664 during the previous five years (2015–2019). However, this is partly due to recent investment in methods to record and validate events, particularly smaller‑scale disasters.
- Where are disasters happening? The geographical distribution of recorded disasters is quite concentrated, with 84% of events occurring in only 37 countries. A number of often‑overlapping factors explain this: these countries are prone to disasters due to the high number of people and assets exposed to natural hazards; they are capable of recording the impacts of hazards when disasters do occur. It also suggests that there is significant under‑reporting across most of sub‑Saharan Africa, where millions of people are exposed to flooding, drought and other hazards, and relatively few events recorded.
- During this period, disasters affected some 697 million people,7 caused 105 million displacements and killed 271,000 people.8 With hydrometeorological hazards driving most of this risk, these numbers are expected to rise in the coming years.
- How do communities respond, or take anticipatory action, with or without international actors? Around 94% of disasters are managed by national governments and communities without international assistance, and this is inherently due to their resilience.
- Which of these questions can be answered confidently and with what data? It is a bitter irony that the most disaster‑prone countries often lack the institutional capacity to systematically capture data on their impacts. As a result, the many disasters which are handled with local response actors and through community resilience go under‑reported. The growing risks to the funding of humanitarian data and information management organizations and services threaten to exacerbate this gap.
Asks, aims, and recommendations
Sustain investment in disaster data systems at local, national and international levels, with particular support to National Societies and local actors to strengthen their capacities for data collection, analysis and sharing.
Enable more evidence-based humanitarian action and decision-making through improved data collection, analysis and use.
States and policy-makers
- Invest in comprehensive and reliable disaster data collection systems.
- Commit to greater transparency and the use of evidence-based funding allocation processes.
Humanitarian actors
- Commit to generating and sharing the strongest possible evidence collectively, rather than advancing isolated evidence.
- Work transparently to acknowledge data gaps, limitations, and biases so data and evidence are used appropriately.
Communities and local leaders
- Insist on being involved in data collection and analysis, and assert an essential role in validating data and evidence generated by others.
- Collaborate with humanitarian actors and donors to ensure community insights inform ongoing responses and interventions.
Endnotes
Footnotes
-
The data analysed for these insights comes from Montandon, the world’s largest open-source, open-access disaster database, integrating data on natural hazards and impacts from several sources. https://go.ifrc.org/montandon-landing ↩
-
We use the term "displacements" rather than "displaced people" because a fraction of the 160 million displacements reflects individuals displaced multiple times. ↩
-
Given how data on affected populations is collected, this figure double-counts people affected by more than one disaster during this period. ↩
-
From Montandon, EM-DAT, and IDMC-GIDD. ↩
-
European Commission, INFORM Severity Index. https://drmkc.jrc.ec.europa.eu/inform-index/INFORM-Severity/Severity-Facts-Figures ↩
-
IPCC. Summary for Policymakers, in Climate Change 2022: Impacts, Adaptation and Vulnerability. Cambridge University Press, 2022. http://www.ipcc.ch/report/ar6/wg2/downloads/report/IPCC_AR6_WGII_SummaryForPolicymakers.pdf ↩
-
Given how data on affected populations is collected, this figure double-counts people affected by more than one disaster during this period. ↩
-
From Montandon, EM-DAT, and IDMC-GIDD. ↩